分享一下在主机中使用 gdb 工具分析 linux 内核产生 Call Trace 信息的方法。
平台信息
平台: RUBIK Pi 3 (QCS6490)
基线: Qualcomm Linux 1.5
Yocto 版本:scarthgap
Linux 内核版本:6.6
GDB 分析 Linux Call Trace 的方法和平台无关,各平台和基线都适用。
结论先行(没那么复杂,核心就两条命令)
使用 gdb 可分析 vmlinux 和 .ko 文件,根据地址或函数符号 + 地址偏移,就能定位到出错的代码,具体到文件和行数;大多情况的空指针访问问题都可以快速定位;
一种 ko 文件的分析命令:
gdb-multiarch camera_qcm6490.ko

list *(cam_register_subdev+0xac)
可能需要了解的
GDB
GDB(GNU Debugger)是一个强大的源代码级调试器,除了能调试用户层运行时的程序外(如打断点等),还能分析试静态的 Linux 文件。
- 为什么能调试静态的文件,使用下面的命令可以查看 elf 文件的段信息
readelf -S vmlinux
输出结果:
tsdl@tsdl-HP-EliteDesk-880-G6-Tower-PC:~/Downloads$ readelf -S vmlinux
There are 43 section headers, starting at offset 0x14dd61c0:

Section Headers:
  [Nr] Name              Type             Address           Offset
       Size              EntSize          Flags  Link  Info  Align
  [ 0]                   NULL             0000000000000000  00000000
       0000000000000000  0000000000000000           0     0     0
  [ 1] .head.text        PROGBITS         ffffffc080000000  00010000
       0000000000010000  0000000000000000  AX       0     0     65536
  [ 2] .text             PROGBITS         ffffffc080010000  00020000
       0000000000ed3000  0000000000000000  AX       0     0     65536
  [ 3] .rodata           PROGBITS         ffffffc080ef0000  00f00000
       0000000000727666  0000000000000000  WA       0     0     4096
  [ 4] .pci_fixup        PROGBITS         ffffffc081617670  01627670
       0000000000002d90  0000000000000000   A       0     0     16
  [ 5] __ksymtab         PROGBITS         ffffffc08161a400  0162a400
       000000000000f7d4  0000000000000000   A       0     0     4
  [ 6] __ksymtab_gpl     PROGBITS         ffffffc081629bd4  01639bd4
       0000000000017808  0000000000000000   A       0     0     4
  [ 7] __ksymtab_strings PROGBITS         ffffffc0816413dc  016513dc
       0000000000040e5d  0000000000000001 AMS       0     0     1
  [ 8] __param           PROGBITS         ffffffc081682240  01692240
       00000000000037a0  0000000000000000   A       0     0     8
  [ 9] __modver          PROGBITS         ffffffc0816859e0  016959e0
       0000000000000510  0000000000000000  WA       0     0     8
  [10] __ex_table        PROGBITS         ffffffc081685ef0  01695ef0
       0000000000002b80  0000000000000000   A       0     0     4
  [11] .notes            NOTE             ffffffc081688a70  01698a70
       0000000000000054  0000000000000000   A       0     0     4
  [12] .hyp.rodata       PROGBITS         ffffffc081689000  01699000
       0000000000005000  0000000000000000  WA       0     0     16
  [13] .got              PROGBITS         ffffffc08168e000  0169e000
       0000000000000070  0000000000000008  WA       0     0     8
  [14] .got.plt          PROGBITS         ffffffc08168e070  0169e070
       0000000000000018  0000000000000008  WA       0     0     8
  [15] .rodata.text      PROGBITS         ffffffc08168e800  0169e800
       0000000000005800  0000000000000000  AX       0     0     2048
  [16] .init.text        PROGBITS         ffffffc0816a0000  016b0000
       0000000000068f14  0000000000000000  AX       0     0     8
  [17] .exit.text        PROGBITS         ffffffc081708f18  01718f18
       000000000000618c  0000000000000000  AX       0     0     8
  [18] .altinstructions  PROGBITS         ffffffc08170f0a4  0171f0a4
       000000000004e240  0000000000000000   A       0     0     1
  [19] .init.data        PROGBITS         ffffffc081765000  01775000
       0000000000035cd8  0000000000000000  WA       0     0     256
  [20] .data..percpu     PROGBITS         ffffffc08179b000  017ab000
       0000000000015168  0000000000000000  WA       0     0     64
  [21] .hyp.data..percpu PROGBITS         ffffffc0817b1000  017c1000
       00000000000021c0  0000000000000000  WA       0     0     16
  [22] .hyp.reloc        PROGBITS         ffffffc0817b31c0  017c31c0
       0000000000000270  0000000000000000   A       0     0     4
  [23] .rela.dyn         RELA             ffffffc0817b3430  017c3430
       0000000000548610  0000000000000018   A       0     0     8
  [24] .data             PROGBITS         ffffffc081d00000  01d10000
       00000000004b56a8  0000000000000000  WA       0     0     4096
  [25] __bug_table       PROGBITS         ffffffc0821b56a8  021c56a8
       0000000000018ed0  0000000000000000  WA       0     0     4
  [26] .mmuoff.data.writ PROGBITS         ffffffc0821ce800  021de800
       0000000000000008  0000000000000000  WA       0     0     2048
  [27] .mmuoff.data.read PROGBITS         ffffffc0821cf000  021df000
       0000000000000008  0000000000000000  WA       0     0     8
  [28] .pecoff_edata_pad PROGBITS         ffffffc0821cf008  021df008
       00000000000001f8  0000000000000000   A       0     0     1
  [29] .bss              NOBITS           ffffffc0821d0000  021df200
       00000000000ac680  0000000000000000  WA       0     0     4096
  [30] .debug_aranges    PROGBITS         0000000000000000  021df200
       000000000002d960  0000000000000000           0     0     16
  [31] .debug_info       PROGBITS         0000000000000000  0220cb60
       000000000d6244df  0000000000000000           0     0     1
  [32] .debug_abbrev     PROGBITS         0000000000000000  0f83103f
       0000000000673382  0000000000000000           0     0     1
  [33] .debug_line       PROGBITS         0000000000000000  0fea43c1
       0000000001b1316d  0000000000000000           0     0     1
  [34] .debug_frame      PROGBITS         0000000000000000  119b7530
       000000000039aed8  0000000000000000           0     0     8
  [35] .debug_str        PROGBITS         0000000000000000  11d52408
       000000000048de8c  0000000000000001  MS       0     0     1
  [36] .debug_line_str   PROGBITS         0000000000000000  121e0294
       0000000000025f05  0000000000000001  MS       0     0     1
  [37] .debug_loclists   PROGBITS         0000000000000000  12206199
       0000000001fa5a54  0000000000000000           0     0     1
  [38] .debug_rnglists   PROGBITS         0000000000000000  141abbed
       0000000000473639  0000000000000000           0     0     1
  [39] .comment          PROGBITS         0000000000000000  1461f226
       0000000000000012  0000000000000001  MS       0     0     1
  [40] .symtab           SYMTAB           0000000000000000  1461f238
       00000000004b2568  0000000000000018          41   171684     8
  [41] .strtab           STRTAB           0000000000000000  14ad17a0
       0000000000304849  0000000000000000           0     0     1
  [42] .shstrtab         STRTAB           0000000000000000  14dd5fe9
       00000000000001d0  0000000000000000           0     0     1
Key to Flags:
  W (write), A (alloc), X (execute), M (merge), S (strings), I (info),
  L (link order), O (extra OS processing required), G (group), T (TLS),
  C (compressed), x (unknown), o (OS specific), E (exclude),
  p (processor specific)
其中可以看到有 debug 段的信息,只要要分析的静态文件有 debug 段,一般都可以使用 gdb 来进行分析,比如:
进入 gdb 模式
gdb-multiarch vmlinux
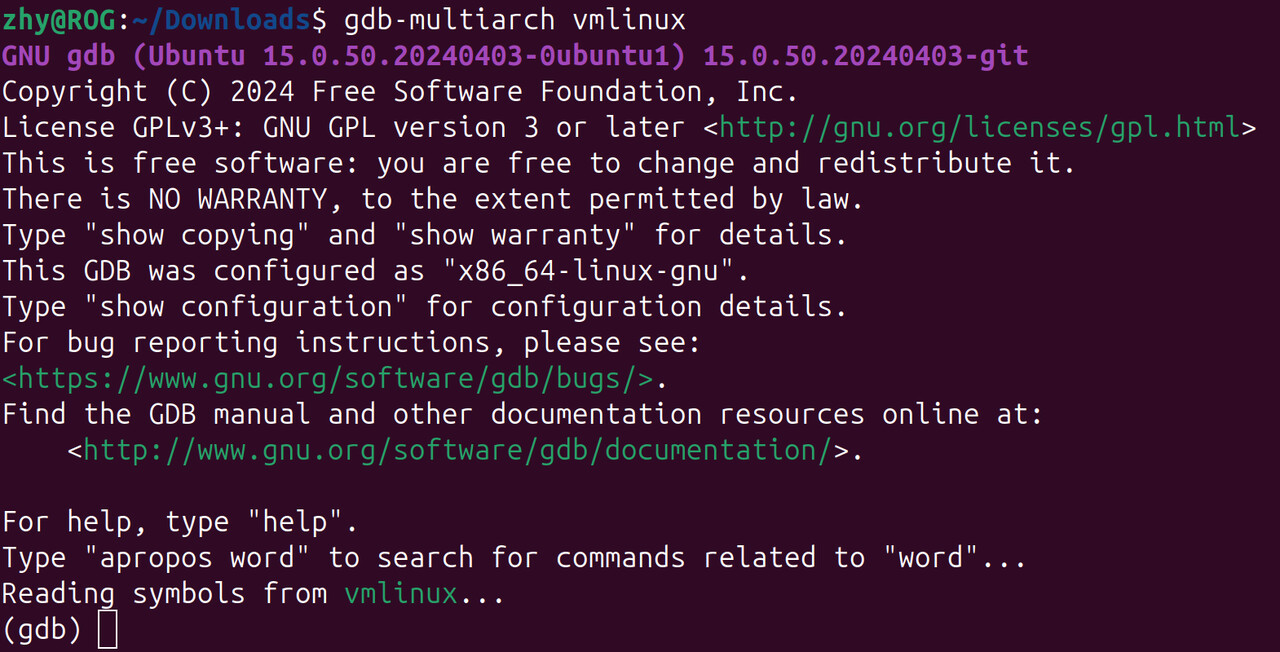
gdb-multiarch 命令可以通过如下命令安装:
sudo apt install gdb-multiarch
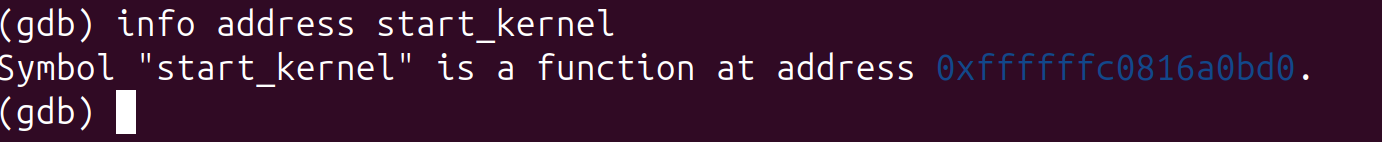
获取函数加载地址
info address start_kernel
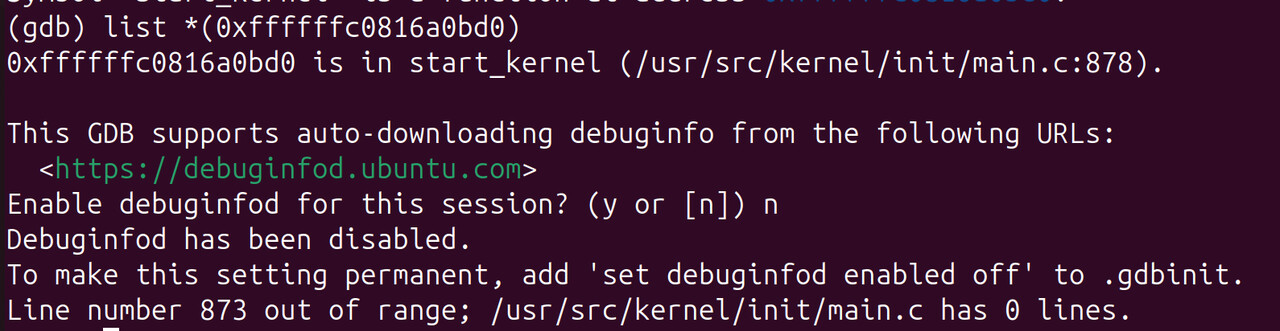
根据地址查看在哪个源码文件,哪行
list *(0xffffffc0816a0bd0)
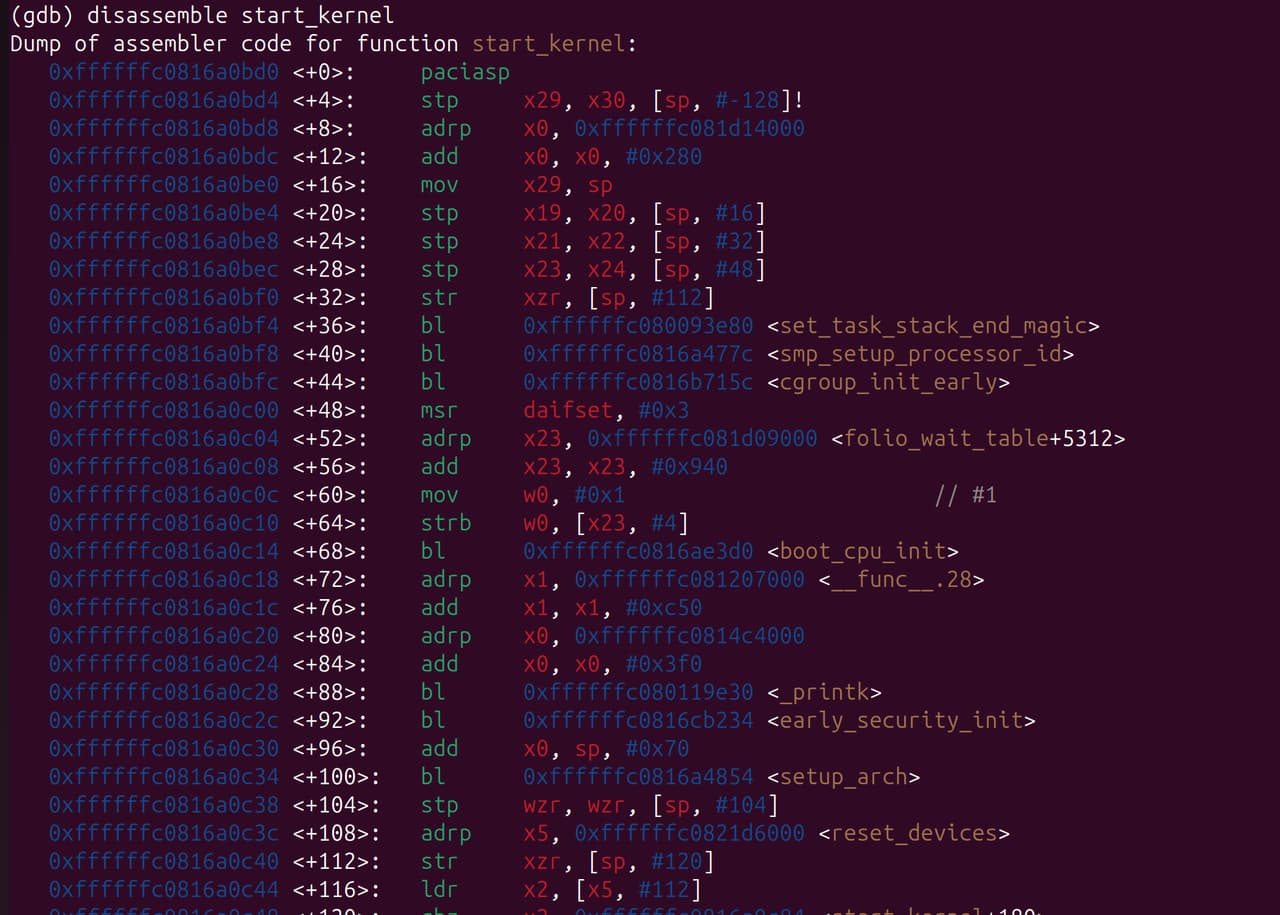
查看反汇编代码
disassemble start_kernel
退出 GDB 模式
quit
vmlinux
- 常见内核镜像以及对应关系:

vmlinux (其中 VM 是指,Virtual Memory)是未经压缩的 Linux 内核 ELF 文件,包含完整符号表和调试信息,未进行任何压缩或优化,通常,这个文件不会被直接用于启动系统,而是作为生成其他格式内核映像的基础,主要用于内核开发和调试。
.ko
.ko(kernel object)是内核使用的动态链接文件,可以动态的加载,一般驱动会编译为 ko ,在开机时自动加载;
ko 文件包含符号信息(偏移地址),可以使用 GDB 工具分析。
要注意的是 ko 文件是可重定位文件,不是可执行文件,这代表 ko 没有固定加载地址, 模块的加载地址一般可通过 cat /proc/kallsyms 节点来获取; 不过大多数时候内核 crash 时无法进入系统,我们仍然可以 call trace 中的符号 + 偏移地址定位问题。
分析过程
内核模块(ko 文件)造成 Call Trace
背景
开机时内核因空指针 crash,串口打印 Call Trace 信息后重启(未开 dump 模式),需解决 crash 问题。
[    6.275632][  T126] Unable to handle kernel NULL pointer dereference at virtual address 0000000000000008
[    6.285379][  T126] Mem abort info:
[    6.285380][  T126]   ESR = 0x0000000096000045
[    6.285381][  T126]   EC = 0x25: DABT (current EL), IL = 32 bits
[    6.289274][  T126]   SET = 0, FnV = 0
[    6.289275][  T126]   EA = 0, S1PTW = 0
[    6.289276][  T126]   FSC = 0x05: level 1 translation fault
[    6.289277][  T126] Data abort info:
[    6.289277][  T126]   ISV = 0, ISS = 0x00000045, ISS2 = 0x00000000
[    6.289278][  T126]   CM = 0, WnR = 1, TnD = 0, TagAccess = 0
[    6.289279][  T126]   GCS = 0, Overlay = 0, DirtyBit = 0, Xs = 0
[    6.289280][  T126] user pgtable: 4k pages, 39-bit VAs, pgdp=000000010c261000
[    6.289699][  T674] CAM_INFO: CAM-SMMU: cam_smmu_need_force_alloc_cached: 383: force_cache_allocs=0
[    6.289712][  T674] CAM_ERR: CAM-MEM: cam_mem_mgr_get_dma_heaps: 474: qcom system-uncached heap not found, rc=0
[    6.289805][  T674] CAM_WARN: CAM-CRM: cam_req_mgr_close: 189: release invoked associated userspace process has died, open_cnt: 1
[    6.293860][  T618] cam_req_mgr soc@0:qcom,cam-req-mgr: bound soc@0:qcom,cam_smmu (ops cam_smmu_component_ops [camera_qcm6490])
[    6.300568][  T126] [0000000000000008] pgd=0000000000000000
[    6.304048][  T618] cam_req_mgr soc@0:qcom,cam-req-mgr: bound soc@0:qcom,cam_smmu:msm_cam_smmu_secure (ops cam_smmu_cb_component_ops [camera_qcm6490])
[    6.309886][  T126] , p4d=0000000000000000
[    6.313768][  T618] cam_req_mgr soc@0:qcom,cam-req-mgr: bound soc@0:qcom,cam_smmu:msm_cam_smmu_lrme (ops cam_smmu_cb_component_ops [camera_qcm6490])
[    6.320006][  T126] , pud=0000000000000000
[    6.323810][  T618] cam_req_mgr soc@0:qcom,cam-req-mgr: bound soc@0:qcom,cam_smmu:msm_cam_smmu_cpas_cdm (ops cam_smmu_cb_component_ops [camera_qcm6490])
[    6.329850][  T126]
[    6.333849][  T526] lt9611 9-0039: audio support = 0
[    6.333910][  T526] lt9611 9-0039: supply vdd not found, using dummy regulator
[    6.335907][  T618] cam_req_mgr soc@0:qcom,cam-req-mgr: bound soc@0:qcom,cam_smmu:msm_cam_smmu_icp (ops cam_smmu_cb_component_ops [camera_qcm6490])
[    6.343223][  T126] Internal error: Oops: 0000000096000045 [#1] PREEMPT SMP
[    6.343227][  T126] Modules linked in: lontium_lt9611(+)
[    6.352610][  T618] cam_req_mgr soc@0:qcom,cam-req-mgr: bound soc@0:qcom,cam_smmu:msm_cam_icp_fw (ops cam_smmu_fw_dev_component_ops [camera_qcm6490])
[    6.363032][  T126]  rpmsg_ctrl camera_qcm6490(OE+) cec husb238 qrtr_smd fastrpc rpmsg_char rpisense_core kfifo_buf snd_soc_es8316 spidev qmi_cooling typec_ucsi pmic_glink_altmode qcom_battmgr hci_uart snd_sw
[    6.375104][  T618] cam_req_mgr soc@0:qcom,cam-req-mgr: bound soc@0:qcom,cam_smmu:msm_cam_smmu_jpeg (ops cam_smmu_cb_component_ops [camera_qcm6490])
[    6.386846][  T126]  bcmdhd snd_soc_qcom_common bluetooth iris_vpu(O) gpio_sbu_mux snd_soc_simple_card_utils v4l2_mem2mem videobuf2_v4l2 cfg80211
[    6.392585][  T618] cam_req_mgr soc@0:qcom,cam-req-mgr: bound soc@0:qcom,cam_smmu:msm_cam_smmu_ife (ops cam_smmu_cb_component_ops [camera_qcm6490])
[    6.406389][  T126]  ocmem videodev gpu_sched qcom_pon drm_display_helper nvmem_qcom_spmi_sdam qcom_spmi_adc_tm5 rtc_pm8xxx ecdh_generic
[    6.411214][  T618] CAM_INFO: CAM-CPAS: cam_cpas_get_hw_features: 515: feature 0x4 addr 0x7801fc, mask 0x10, shift 0x4 type 0x0 hw_map 0x4
[    6.424232][  T126]  ecc videobuf2_common drm_dp_aux_bus qcom_stats rfkill mc spi_geni_qcom i2c_qcom_geni phy_qcom_qmp_combo typec gpi msm_kgsl(O) icc_bwmon
[    6.428455][  T618] CAM_INFO: CAM-CPAS: cam_cpas_get_hw_features: 539: fuse_addr 0x7801fc, fuse_val 70000
[    6.442442][  T126]  qcom_eud qcrypto qcom_q6v5_pas pinctrl_sc7280_lpass_lpi qcom_rproc_minidump display_connector qcom_pil_info pinctrl_lpass_lpi llcc_qcom sha256_generic
[    6.444694][  T618] CAM_INFO: CAM-CPAS: cam_cpas_get_hw_features: 598: feature 0x4 enable=1 hw_map=0x4
[    6.447554][  T124] Bluetooth: hci0: BCM: chip id 130
[    6.447845][  T124] Bluetooth: hci0: BCM: features 0x0f
[    6.448966][  T124] Bluetooth: hci0: BCM4345C5
[    6.448971][  T124] Bluetooth: hci0: BCM4345C5 (003.006.006) build 0000
[    6.449711][  T124] Bluetooth: hci0: BCM4345C5 'brcm/BCM4345C5.hcd' Patch
[    6.449784][  T126]  qcom_q6v5 xhci_pci authenc drm_kms_helper qcom_sysmon xhci_pci_renesas libdes pwm_fan
[    6.457201][  T618] CAM_INFO: CAM-CPAS: cam_cpas_get_hw_features: 515: feature 0x6 addr 0x7801fc, mask 0x20, shift 0x5 type 0x0 hw_map 0x10
[    6.470746][  T126]  qcom_rng pmic_glink icc_osm_l3 socinfo stm_p_ost stm_heartbeat stm_ftrace
[    6.477898][  T618] CAM_INFO: CAM-CPAS: cam_cpas_get_hw_features: 598: feature 0x6 enable=1 hw_map=0x10
[    6.483342][  T126]  stm_console nt36xxx_i2c(O) panel_event_notifier ipa qcom_common qcom_glink_smem
[    6.497075][  T618] CAM_INFO: CAM-CPAS: cam_cpas_get_hw_features: 515: feature 0x7 addr 0x7801fc, mask 0x40, shift 0x6 type 0x0 hw_map 0xff
[    6.520495][  T126]  mdt_loader coresight_tpdm coresight_tpda coresight_tmc usb_f_qdss coresight_tgu coresight_stm stm_core coresight_replicator
[    6.534143][  T618] CAM_INFO: CAM-CPAS: cam_cpas_get_hw_features: 598: feature 0x7 enable=1 hw_map=0xff
[    6.547504][  T126]  qrtr coresight_remote_etm coresight_csr coresight_funnel coresight_dummy zram zsmalloc drm
[    6.561062][  T618] CAM_INFO: CAM-CPAS: cam_cpas_get_hw_features: 515: feature 0x0 addr 0x7801fc, mask 0x80, shift 0x7 type 0x0 hw_map 0xff
[    6.573631][  T126]  coresight_cti coresight at803x fuse ipv6
[    6.573636][  T126] CPU: 4 PID: 126 Comm: kworker/u16:6 Tainted: G           OE      6.6.90 #1
[    6.586477][  T618] CAM_INFO: CAM-CPAS: cam_cpas_get_hw_features: 598: feature 0x0 enable=1 hw_map=0xff
[    6.600819][  T126] Hardware name: Thundercomm, Inc. RUBIK Pi 3 (DT)
[    6.600820][  T126] Workqueue: events_unbound deferred_probe_work_func
[    6.610729][  T618] CAM_INFO: CAM-CPAS: cam_cpas_get_hw_features: 515: feature 0x8 addr 0x7801fc, mask 0x100, shift 0x8 type 0x0 hw_map 0x10
[    6.626410][  T126]
[    6.626411][  T126] pstate: 60400005 (nZCv daif +PAN -UAO -TCO -DIT -SSBS BTYPE=--)
[    6.626413][  T126] pc : cam_register_subdev+0xac/0x260 [camera_qcm6490]
[    6.636054][  T618] CAM_INFO: CAM-CPAS: cam_cpas_get_hw_features: 598: feature 0x8 enable=1 hw_map=0x10
[    6.641236][  T126] lr : cam_register_subdev+0x70/0x260 [camera_qcm6490]
[    6.646607][  T618] CAM_INFO: CAM-CPAS: cam_cpas_get_hw_features: 515: feature 0x9 addr 0x7801a4, mask 0x10000000, shift 0x1c type 0x0 hw_map 0xff
[    6.651159][  T126] sp : ffffffc0835c3ad0
[    6.651160][  T126] x29: ffffffc0835c3ad0 x28: 0000000000000000 x27: 0000000000000000
[    6.651162][  T126] x26: 0000000000000000 x25: 0000000000000000 x24: 000000000000015e
[    6.657959][  T618] CAM_INFO: CAM-CPAS: cam_cpas_get_hw_features: 539: fuse_addr 0x7801a4, fuse_val 20000000
[    6.664921][  T126]
[    6.664922][  T126] x23: ffffffe860924e60 x22: ffffff808c835b40 x21: ffffff808c835a88
[    6.664924][  T126] x20: ffffffe860927468 x19: ffffff808c835a80 x18: ffffffffffffffff
[    6.674829][  T618] CAM_INFO: CAM-CPAS: cam_cpas_get_hw_features: 598: feature 0x9 enable=1 hw_map=0xff
[    6.680228][  T526] lt9611 9-0039: LT9611 revision: 0xe2.17.02
[    6.687745][  T126] x17: 646e756f66204f49 x16: ffffffe8ce84861c x15: 3132203a61746164
[    6.687747][  T126] x14: 5f74645f7465675f x13: 000000000000054b x12: 00000000ffffffea
[    6.687749][  T126] x11: 00000000ffffdfff
[    6.699094][  T618] CAM_INFO: CAM-CPAS: cam_cpas_hw_get_hw_info: 1862: fuse info->num_fuses 2
[    6.706293][  T126]  x10: ffffffe8cf76c190 x9 : ffffffe8cf6bc130
[    6.706295][  T126] x8 : ffffff8081584d80 x7 : 00000000ffffffff x6 : ffffff808c835b60
[    6.706297][  T126] x5 : 000000000001000c x4 : ffffff808c835c30 x3 : 0000000000000000
[    6.706299][  T126] x2 : ffffffe860821268 x1 : ffffffe8609274d8
[    6.739312][  T526] lt9611 9-0039: CEC adapter registered
[    6.742019][  T126]  x0 : 0000000000000000
[    6.751746][  T526] lt9611 9-0039: CEC init success
[    6.762082][  T126]
[    6.762083][  T126] Call trace:
[    6.762085][  T126]  cam_register_subdev+0xac/0x260 [camera_qcm6490]
[    7.038678][  T126]  cam_eeprom_init_subdev+0x78/0xd0 [camera_qcm6490]
[  OK  ] Found device /dev/fastrpc-adsp-secu[    7.045re.
[    7.083094][  T126]  i2c_device_probe+0x1b4/0x35c
[    7.088835][  T126]  really_probe+0x148/0x2b0
[    7.093415][  T126]  __driver_probe_device+0x78/0x12c
[    7.098704][  T126]  driver_probe_device+0x3c/0x15c
[    7.103814][  T126]  __device_attach_driver+0xb8/0x134
[    7.109188][  T126]  bus_for_each_drv+0x88/0xe8
[    7.113940][  T126]  __device_attach+0xa0/0x190
[    7.118688][  T126]  device_initial_probe+0x14/0x20
[    7.123790][  T126]  bus_probe_device+0xac/0xb0
[    7.128533][  T126]  deferred_probe_work_func+0x88/0xc0
[    7.133985][  T126]  process_one_work+0x170/0x400
[    7.138904][  T126]  worker_thread+0x320/0x438
[    7.143554][  T126]  kthread+0x110/0x114
[    7.143556][  T126]  ret_from_fork+0x10/0x20
[  OK  ] Found device /dev/fastrpc-cdsp-secu[    7.143re.
[    7.189680][  T126] ---[ end trace 0000000000000000 ]---
[    7.195962][  T126] Kernel panic - not syncing: Oops: Fatal exception
[    7.200283][  T124] Bluetooth: hci0: BCM: features 0x0f
[    7.202028][  T124] Bluetooth: hci0: BCM4345C5 Ampak AP5256 UART 37.4 MHz BT 5.2 [Version: 1081.1154]
[    7.202030][  T124] Bluetooth: hci0: BCM4345C5 (003.006.006) build 1154
[    7.224571][  T126] SMP: stopping secondary CPUs
[    7.229406][  T126] Triggering bite
[    7.233079][  T126] gh-watchdog hypervisor:qcom,gh-watchdog: Causing a QCOM Apps Watchdog bite!
[    7.242175][  T126] gh-watchdog hypervisor:qcom,gh-watchdog: vWdog-CTL: 1, vWdog-time since last pet: 2358, vWdog-expired status: 1
分析
- 根据打印信息,可以知道:
a. 对空指针进行访问(因为是64位系统, 0000000000000008 大概率是访问了结构体中的第二个参数)
b. 出现问题的模块名是 camera_qcm6490
c. 最后导致 crash 的函数名是 cam_register_subdev
d. 出现问题的内存地址是 cam_register_subdev+0xac,大概在整个 cam_register_subdev 函数的 28% 处(0xac 是地址偏移,0x260 是整个函数大小(0x260 字节),0xac/0x260 ≈ 172/608 ≈ 0.28,这个 28% 是汇编来说,对 C 可能参考不大)
Unable to handle kernel NULL pointer dereference at virtual address 0000000000000008

cam_register_subdev+0xac/0x260 [camera_qcm6490]
- 获取出现问题的 ko 文件
camera_qcm6490.ko
- 使用 gdb 加载 ko
gdb-multiarch camera_qcm6490.ko
也可以
gdb-multiarch vmlinux
add-symbol-file camera_qcm6490.ko
-
定位文件和行数
a. 定位 cam_register_subdev
info functions cam_register_subdev
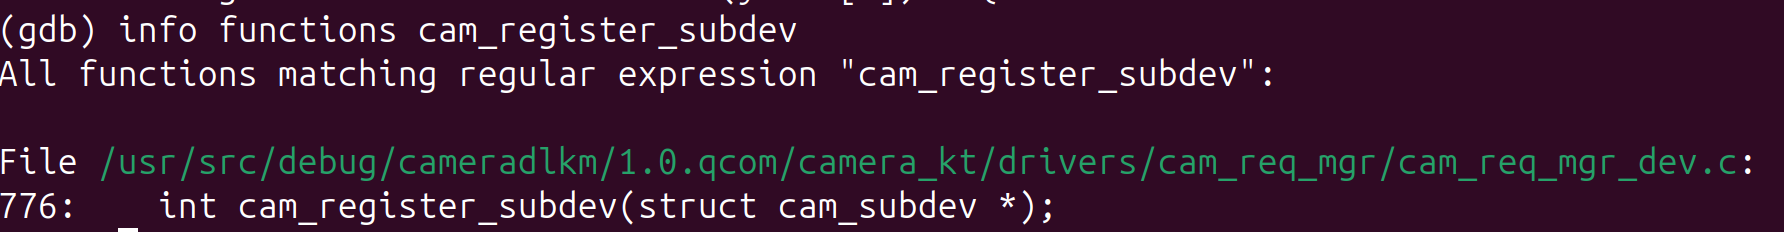
b. 先把整个函数列出来
int cam_register_subdev(struct cam_subdev *csd)
{
        struct v4l2_subdev *sd;
        int rc;

        if (!g_dev.state) {
                CAM_DBG(CAM_CRM, "camera root device not ready yet");
                return -EPROBE_DEFER;
        }

        if (!csd || !csd->name) {
                CAM_ERR(CAM_CRM, "invalid arguments");
                return -EINVAL;
        }

        mutex_lock(&g_dev.dev_lock);

        sd = &csd->sd;
        v4l2_subdev_init(sd, csd->ops);
        sd->internal_ops = csd->internal_ops;
        snprintf(sd->name, V4L2_SUBDEV_NAME_SIZE, "%s", csd->name);
        v4l2_set_subdevdata(sd, csd->token);

        sd->flags = csd->sd_flags;
        sd->entity.num_pads = 0;
        sd->entity.pads = NULL;
        sd->entity.function = csd->ent_function;

        list_add(&csd->list, &cam_req_mgr_ordered_sd_list);
        list_sort(NULL, &cam_req_mgr_ordered_sd_list,
                cam_req_mgr_ordered_list_cmp);

        rc = v4l2_device_register_subdev(g_dev.v4l2_dev, sd);
        if (rc) {
                CAM_ERR(CAM_CRM, "register subdev failed");
                goto reg_fail;
        }

        rc = v4l2_device_register_subdev_nodes(g_dev.v4l2_dev);
        if (rc) {
                CAM_ERR(CAM_CRM, "Failed to register subdev node: %s, rc: %d",
                        sd->name, rc);
                goto reg_fail;
        }

        if (sd->flags & V4L2_SUBDEV_FL_HAS_DEVNODE) {
                sd->entity.name = video_device_node_name(sd->devnode);
                CAM_DBG(CAM_CRM, "created node :%s", sd->entity.name);
        }

        g_dev.count++;

reg_fail:
        mutex_unlock(&g_dev.dev_lock);
        return rc;
}
c. 定位行数
list *(cam_register_subdev+0xac)
在 list.h 的 153 行
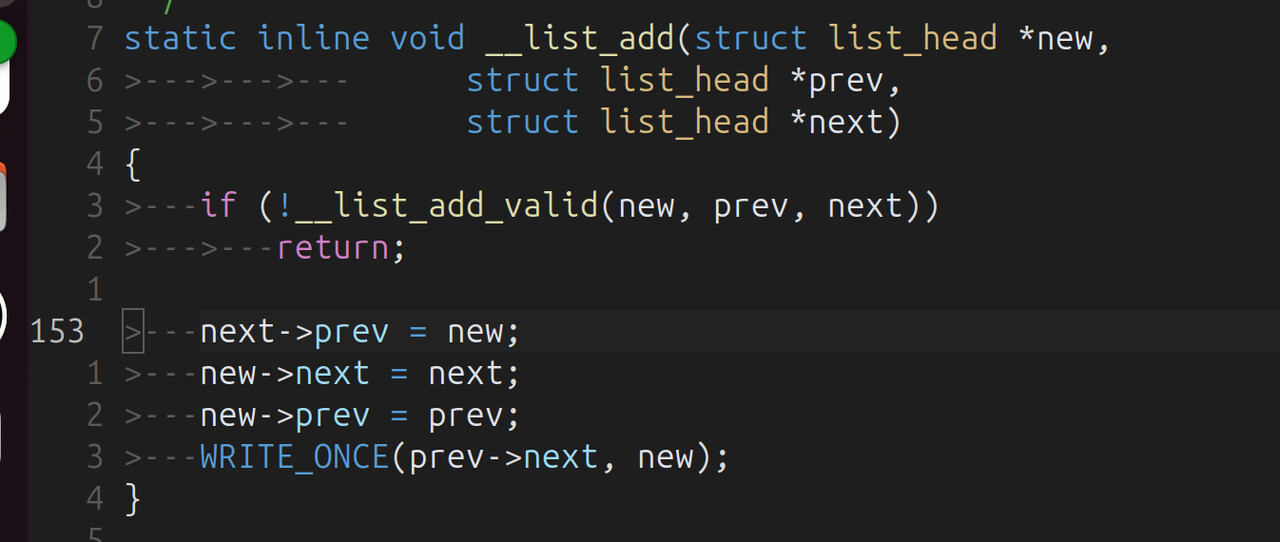
说明是 next->prev = new; 出现问题,next 是空指针,而 prev 正好是 list_head 结构体的第二个参数,猜想正确;
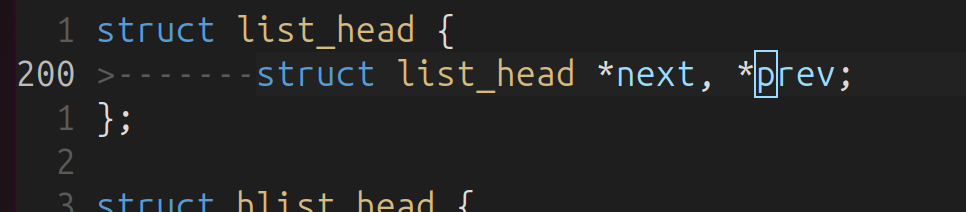
至于为什么定位到了 list.h ,是因为 list 相关的函数大多是 inline 的,所以我们看原函数的链表相关操作的函数:
(这里也可以看汇编代码定位, 比如查看 bl 指令的个数定位)
list_add(&csd->list, &cam_req_mgr_ordered_sd_list);
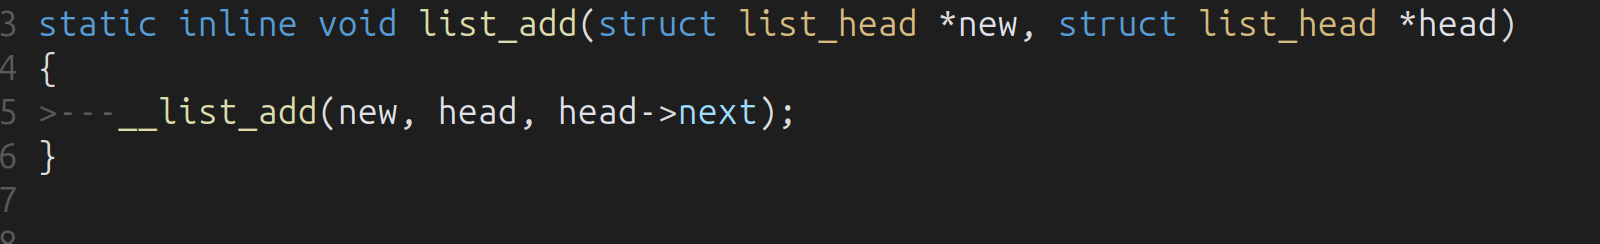
根据 list_add 和 __list_add 函数,我们就可以确定是 cam_req_mgr_ordered_sd_list 的 next 参数没有初始化,也就是 cam_req_mgr_ordered_sd_list 这个链表没有初始化,next 为空,对空指针访问了第二个参数,相当于:
(list_head *)0->prev
解决
在 list_add 前,初始化链表
diff --git a/camera_kt/drivers/cam_req_mgr/cam_req_mgr_dev.c b/camera_kt/drivers/cam_req_mgr/cam_req_mgr_dev.c
index bde4e14f..7df323c8 100644
--- a/camera_kt/drivers/cam_req_mgr/cam_req_mgr_dev.c
+++ b/camera_kt/drivers/cam_req_mgr/cam_req_mgr_dev.c
@@ -33,7 +33,7 @@
 static struct cam_req_mgr_device g_dev;
 struct kmem_cache *g_cam_req_mgr_timer_cachep;
 static struct list_head cam_req_mgr_ordered_sd_list;
-
+static LIST_HEAD(cam_req_mgr_ordered_sd_list);
 DECLARE_RWSEM(rwsem_lock);

 static struct device_attribute camera_debug_sysfs_attr =
@@ -882,8 +882,6 @@ static int cam_req_mgr_component_master_bind(struct device *dev)
         if (rc)
                 goto video_setup_fail;

-        INIT_LIST_HEAD(&cam_req_mgr_ordered_sd_list);
-
         if (g_cam_req_mgr_timer_cachep == NULL) {
                 g_cam_req_mgr_timer_cachep = KMEM_CACHE(cam_req_mgr_timer, 0x0);

--
2.25.1
内核镜像造成 Call Trace
和 ko 是一样的, 等遇到类似问题时更新案例。
参考资料
常用 gdb 命令(来自 AI 仅供参考):
(gdb) info functions          # 查看所有函数符号
(gdb) info variables          # 查看所有变量符号
(gdb) info types              # 查看所有类型定义
(gdb) info functions cam_     # 查看所有 cam_ 开头的函数
(gdb) info variables g_       # 查看所有 g_ 开头的变量
(gdb) info functions ^cam_.*  # 使用正则表达式
(gdb) info address cam_register_subdev    # 查看函数地址
(gdb) info symbol 0xffffffc00123ebd8      # 通过地址查符号名
(gdb) whatis cam_register_subdev          # 查看符号类型
(gdb) disassemble cam_register_subdev           # 反汇编整个函数
(gdb) disassemble cam_register_subdev +0xac     # 从特定偏移开始
(gdb) disassemble 0xffffffc00123ebd8, +20       # 反汇编地址范围
(gdb) disassemble /m cam_register_subdev        # 混合显示源码和汇编
(gdb) disassemble /r cam_register_subdev        # 显示原始字节码
(gdb) disassemble /mr cam_register_subdev       # 混合显示+原始字节
(gdb) maintenance info sections                 # 显示所有段信息
(gdb) info files                                # 显示文件段映射
(gdb) info target                               # 显示目标文件信息
(gdb) x/10i &cam_register_subdev                # 查看代码段
(gdb) x/10x &g_dev                             # 查看数据段
(gdb) x/10s device_name                         # 查看字符串


(gdb) p &cam_register_subdev                    # 获取函数地址
$1 = (void (*)(void)) 0xffffffc00123ebd8
(gdb) p &cam_unregister_subdev                  # 获取下一个函数地址
$2 = (void (*)(void)) 0xffffffc00123ef84

(gdb) p &cam_unregister_subdev - &cam_register_subdev
$3 = 0x3ac                                     # 计算函数大小

(gdb) ptype struct cam_subdev                   # 查看结构体定义
(gdb) ptype /o struct cam_subdev                # 显示偏移布局
(gdb) print sizeof(struct cam_subdev)           # 查看结构体大小
(gdb) print &((struct cam_subdev *)0)->name     # 查看成员偏移